Details
-
Bug
-
Resolution: Invalid
-
 Major
Major
-
None
-
10.9
-
Unknown
-
Description
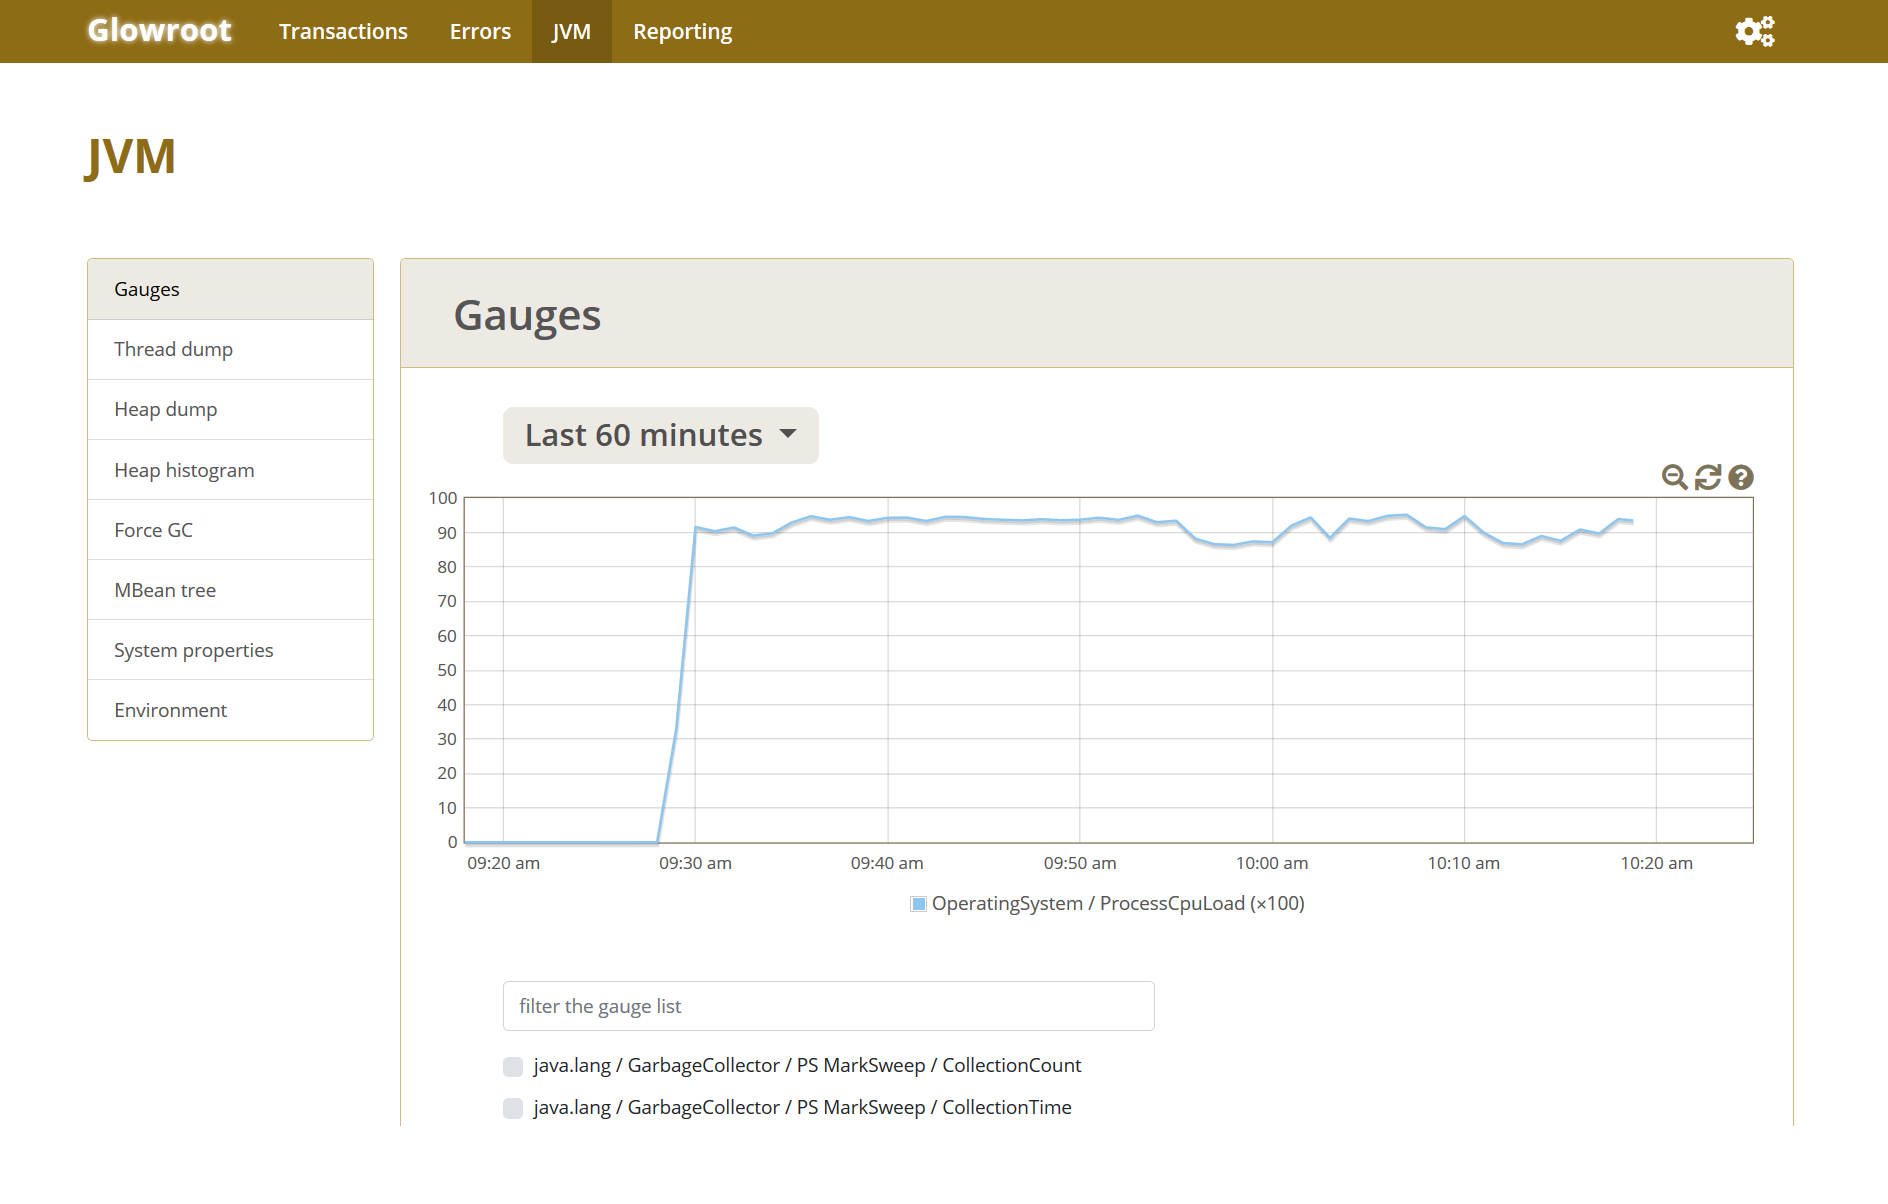
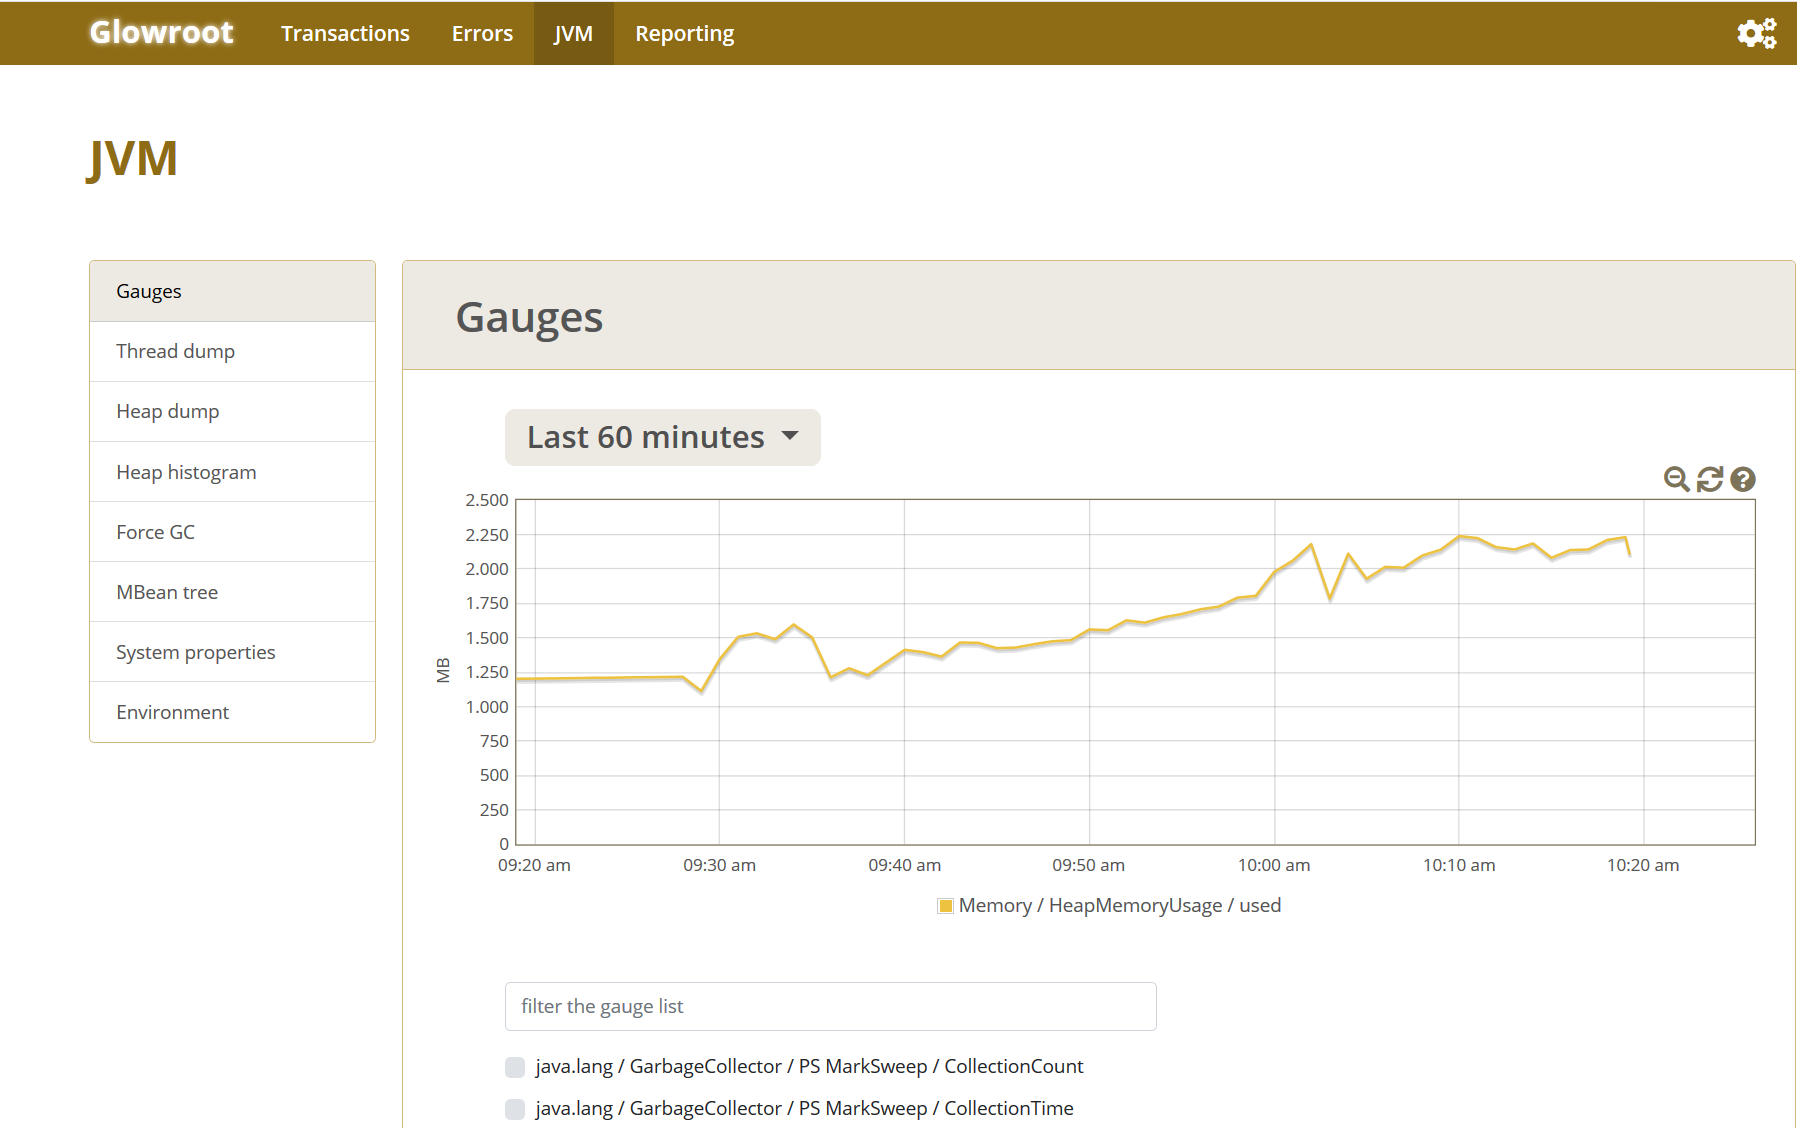
Today I started to create a Diagram. After the system reacted very slow over a longer period of time, I checked with glowroot the Memory and CPU load.
CPU load is almost 100%, memory doubled in size, correlating with the action to create the diagram.That continued for almost one hour until I stoped Tomcat manually.
I am pretty sure I was the only user at that moment and had been for the next hour.
I checked the Thread dump and found multiple Threads blocked. All about notifications.
I attached 2 Thread dumps, taken maybe 5 minutes apart without restart. The Glowroot Screenshot showing the memory and CPU load is also attached.
I have a Heap dump available, but because it is almost 2 GB in size, I am not attaching it to this issue, but can provide it to you on demand.