Uploaded image for project: 'XWiki Platform'
  1. XWiki Platform
  2. XWIKI-6636

Charting macro doesn't display negative values on range_axis

    XMLWordPrintable

Details

    • Bug
    • Resolution: Cannot Reproduce
    • Major
    • None
    • 3.0
    • Chart
    • chart, range_axis, negative value
    • Unknown

    Description

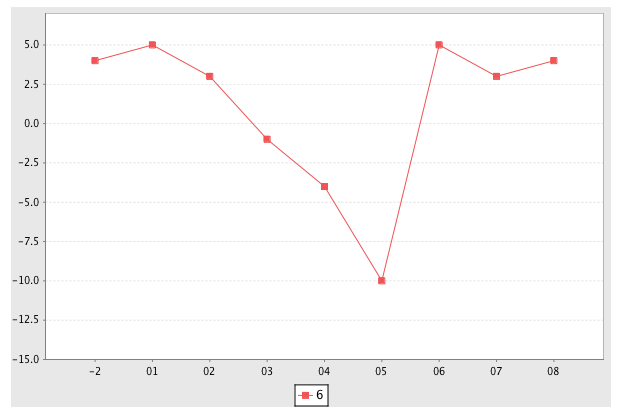
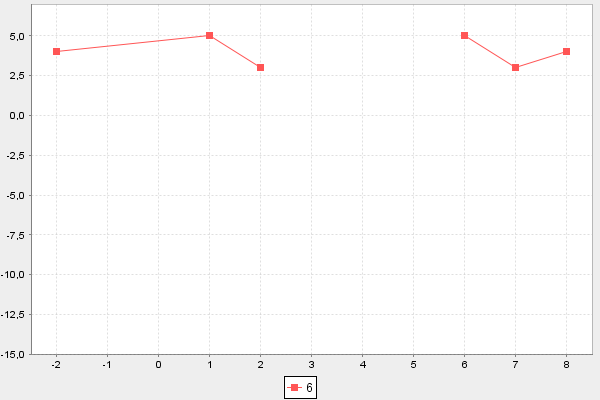
      Trying to generate chart from the table below:

      {table}
      23|6
      -2|4
      01|5
      02|3
      03|-1
      04|-4
      05|-10
      06|5
      07|3
      08|4
      {table}
      

      chart code:

      {chart:type=line|source=type:table;table_number:1;range:*;|series=columns|domain_axis_auto_range=true|range_axis_auto_range=false|range_axis_lower_bound=-15|range_axis_upper_bound=7|range_axis_range_type=full|domain_axis_range_type=full|height=400|width=600}
      

      see the file attached

      Attachments

        Activity

          People

            evalica Ecaterina Moraru (Valica)
            nurlani Nurlan Abdrassilov
            Votes:
            0 Vote for this issue
            Watchers:
            2 Start watching this issue

            Dates

              Created:
              Updated:
              Resolved: