Details
-
Improvement
-
Resolution: Fixed
-
 Major
Major
-
7.4
-
None
Description
Properties:
- plot border: "plotBorderVisible"
- legend: "legendVisible"
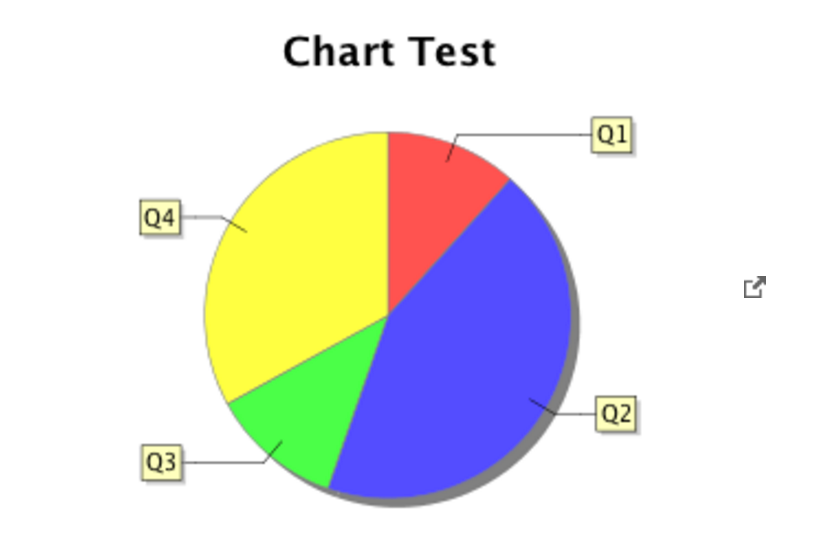
Example usage:
{{chart type="pie" source="inline" params="range:B2-D5;series:columns;backgroundColor:FFFFFF;plotBackgroundColor:FFFFFF;plotBorderVisible:false;legendVisible:false" title="Chart Test" width="320" height="240"}}
|=|=X|=Y|=Z
|Q1|1.2|3.4|1.3
|Q2|4.5|3.4|2.3
|Q3|1.2|4.5|9.0
|Q4|3.4|1.2|1.2
{{/chart}}